Variation of ecosystem processes along the chronosequence
 Accumulation of biomass as well as the pools and fluxes of nutrients change
along the chronosequence. Generally, ecosystem processes do not change linearly
with stand age because they are affected by several factors such as forest
composition, development stages and mortality caused by spruce budworm outbreaks
which changes the forest cover. Forest composition has important effects on
ecosystem processes because the main tree species contrast by their growth
rates, their nutrient requirements and by the quality of their litter. Accumulation of biomass as well as the pools and fluxes of nutrients change
along the chronosequence. Generally, ecosystem processes do not change linearly
with stand age because they are affected by several factors such as forest
composition, development stages and mortality caused by spruce budworm outbreaks
which changes the forest cover. Forest composition has important effects on
ecosystem processes because the main tree species contrast by their growth
rates, their nutrient requirements and by the quality of their litter.
Among all species, aspen produces the greatest amount of biomass and
favors a greater cycling of nutrients within the ecosystem. At all stages along
the chronosequence the total stand biomass is correlated with the proportion
of aspen biomass (Table I). Furthermore, this species has high calcium (Ca)
requirements (e.g. : Ca in aboveground biomass of 60 year-old aspen
@ 900 kg/ha compared to 300 kg/ha for jack pine) and favors a
high forest floor pH (pHH20 : Populus=5.55 : Betula=5.06
conifers=5.07). The soil acidifies during the aggradation phase (75 years) and then
remains relatively stable (Table I). However, soil acidity greatly varies spatially in
relation to forest cover. Net nitrogen mineralization and potential nitrification were
found to be higher under deciduous stands with a N rich litter but these differences
disappeared with stand age (fig. 1). A massive woody litter input to the soil,
corresponding to the decline of the first aspen cohort, could explain the lack of
differences between species in older forests. Species effects were found to be generally
similar on till and clay deposits. However, the clay soils contain greater pools of
nutrients and the fine particles stabilize greater amounts of carbon and nitrogen.
Ref. : Brais et al., 1995 ; Paré & Bergeron, 1995; Paré & Bergeron, 1996.
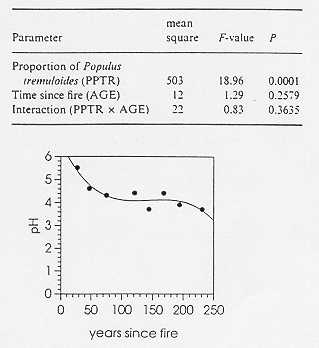
Table I. Regression analysis for the effects of the proportion of Populus
tremuloïdes, time since fire and their interaction on estimated
above-ground tree biomass prior to the spruce budworm outbreak.
|
|
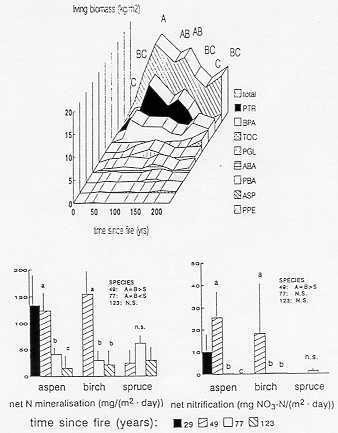
Fig. 1. Changes in the amount of living above-ground biomass along the
chronosequence (per species and total). Means of the total amount topped
by the same letter are not significantly different.
|

|